School Context
Overview
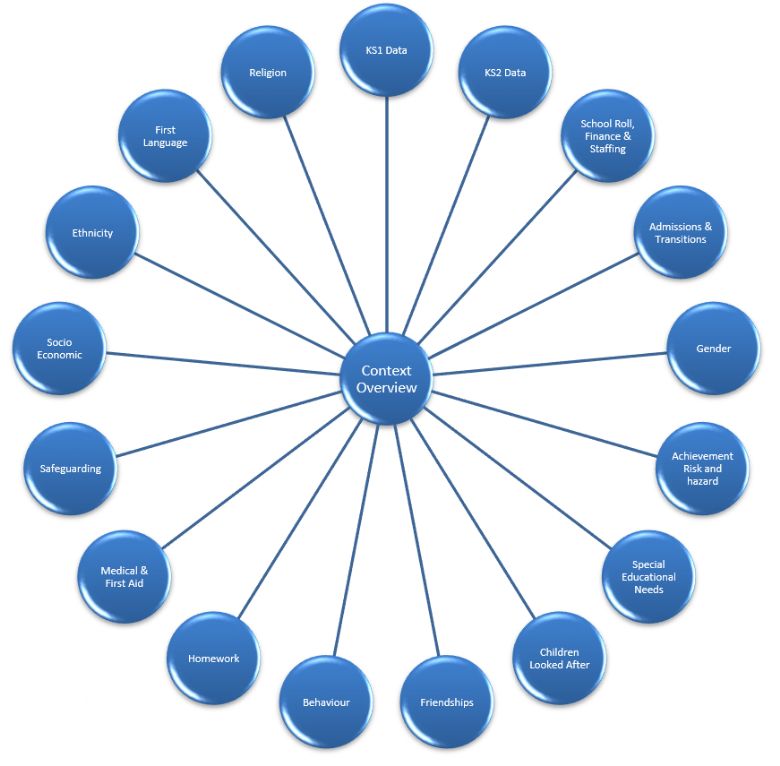
Each year senior leaders review a wide range of data across 17 areas. By reviewing data trends in these areas leaders are able to confidently set the strategic and operational direction of the school. This in turn underpins school performance. The page is arranged firstly by the top 10 areas for consideration based on the most recent data. Secondly, a detailed overview of each area is published. The areas of focus are included in the diagram below:
Key Aspects for Consideration
|
Rank |
Item |
Brief Guide |
|
1 |
The volume of children at the highest level of child protection. The disproportionate impact on pupil premium children and the correlation with target estimates. |
95 children (15%+) on roll currently have been subject to the highest form of child protection and concern and/or intervention (level 4). This proportion is @double the proportion in historic data, indicating a very significant increase in child protection work undertaken by the pastoral team. Almost 50% of pupil premium children have been referred, placed or received intervention at Level 4, the highest safeguarding threshold. 12+X greater than non pupil premium children. There is a direct correlation between academic risk/ RWM target estimates and safeguarding thresholds. The higher the academic ability the higher the safeguarding risk i.e. Above ARE target estimate group have @1:20 chance of safeguarding registration internally/ externally against 1:2 chance for below ARE. |
|
2 |
The financial impact of reducing school roll and the impact of multiples of 30 on the opportunity cost within the school budget. |
Roll reduced by 34 (34x4250= -£144500) compounded by class organisation with -49 children from multiples of 30 = -£208,250 opportunity cost. |
|
3 |
The disproportionate impact of contextual issues for children registered as pupil premium |
|
|
4 |
Submission rates for homework |
Submission rates have decreased notably between children off roll and children on roll. There is a stark correlation between RWM target setting and submission of homework. |
|
5 |
The proportion of SEN on school roll, particularly the proportion of severe and complex need requiring an EHCP. |
All SEN 25% of school population, 152 children 3.4%, expected to rise beyond 4% |
|
6 |
The current staffing cost required to meet the needs of SEN, EAL and Pupil Premium children |
The current cost of staffing broadly allocated for the groups is @£798K with income of @£680K. Given the falling roll and therefore school budget this position will be increasingly difficult to sustain. |
|
7 |
Sustaining effective support for EAL children |
Currently there are 34 children on the EAL register and a further 22 being monitored. There are 11 children on the register whose English language level is emerging. This group require frequent and substantial support. This has been frustrated with ill health, however a recent resignation will lead to a review of this role including the time required to undertake the role. Family contact has been severely disrupted during the COVID closure. |
|
8 |
The correlation of friendship data for less able and more vulnerable children. |
Friendships between children are overwhelmingly stable and positive within school >80%. However, there is a very clear and broadly consistent relationship between friendship quality and academic target. The higher the academic target the higher the equality of friendship is noted. Although it is not clear regarding the cause and effect relationship, there is a relationship. Friendships are a critical part of a child’s belonging and confidence, it would certainly make sense that disruption to friendships would impact directly on achievement. |
|
9 |
School stability has reduced and in Year Admissions and transitions are now broadly net negative. |
Although the number of children admitted after Year 3 Day 1 has increased, so has the number of children transitioning before the last day in Year 6. Overall stability has reduced. The current Y6 cohort has changed by 45% - 35 leavers and 33 joiners. More concerning is the overall net effect is negative. |
|
10 |
The extent to which Chesswood truly reflects its community with regard to ethnicity, language and religion |
Chesswood Junior School is a very diverse school community with very narrow leadership, staffing and governor diversity. On that basis, it is important to persistently look for opportunities to embrace and reflect the diversity through policy, practice in a range of areas e.g. curriculum, school environment, governor representation. |
Aspect Data Review
School Size, Finance & Class organisation
| IDSR (inspection data summary report) | Latest School Level Data |
|
The report indicates school size is more than double the average primary school size in England and within the highest quintile (20%) 2018/19 school received £2,309,014; £1 million more than average. Given the school is more than double the national average it is questionable that school funding is not @ double – school funding was @£200,000 lower than double. This is consistent with the previous financial year. A -£31K deficit was recorded in that year. Spending is recorded at £3798 per child. These figures do not line up exactly with school revenue and expenditure – school receives and spends more when gross figures are considered. |
The number of pupils has decreased from 2019 by 34 children. There are currently 611 pupils. It is expected school roll will reduce by 60 over the next 4 years. We have -49 compared to the class multiple of 30 (-£208K). We currently have 21 mainstream classes plus one high needs class in Year 6 (22 classes). Pupil numbers dictate 20 classes School revenue and expenditure have increased @£300K since last year and £1 million since 2016. It is now @ £2,900,000. Per pupil funding increased £800 to @£4800 – 3 classes in excess of 30 children. The average class size is 28 (611/21 mainstream classes) an reduction on the 2019 average of 29. Maximum Class size in school is 31. There are 11 classes =<28. There is a high need high support class of 15 children. |
Admissions and Transitions – After day 1 Year 3
|
IDSR (inspection data summary report) |
Latest School Level Data |
|
Stability continues to be higher than the national average at 88% falling from 92%. The national stability fell significantly 5% to 81%. School stability resides in the second quintile and is therefore above average. |
The current Y6 cohort has changed by 68 children, 45% - 35 leavers and 33 joiners – significantly higher than previous turnover. The whole school rate of change is in excess of 30% with this method of calculation i.e. the proportion of children who are different from day 1 Year 3. In year admissions are variable by year group increasing significantly (double) from 2015 – 25-33 by Y6. With the exception of current Y4, all year group sizes have decreased marginally in size since the start of Y3 – 2-6 pupils. 68 children have been admitted outside of normal entry into all year groups. Historically a disproportionate number admitted have been disadvantaged Pupil premium and high need – this trend has reduced but remains for SEN. Admissions from outside of Worthing continue to provide the highest number of admissions, followed by local schools (Downsbrook being largest among these with 18 children enrolled after Y3). We expect a sharp fall in transfers from Downsbrook and transfers from other schools are now rare. There is no longer any clear trend from specific year groups when children typically leave, previously it was Y3 & 4. Of the 79 children removed from cohorts 2017 to 2020, the influence Chesswood school could reasonably have over the decisions taken for transfer away is overwhelmingly none existent (50 – 75%). In 4 cases, Chesswood may have had a significant influence on the transfer. |
Gender
|
IDSR (inspection data summary report) |
Latest School Level Data |
|
|
All year groups are broadly aligned except for Year 5 2018 that is boy dominant 98:73 Boys are significantly more likely to: • Be registered for SEN (1.5 times greater proportion at 31%) • Present Challenging Behaviour (more then 3 times greater proportion) Girls routinely outperform boys with reading, writing and maths acquisition by the end of Year 6 with similar disparity at the end of KS1. |
Special Educational Needs
|
IDSR (inspection data summary report) |
Latest School Level Data |
|
The proportion of children registered with SEN has consistently been above national proportions and it has increased a further 7% to 22.6% - since 2018. This is almost double the national %. Chesswood is in the highest quintile nationally for SEN overall. Children subject to an EHCP (Education Health Care Plan) were recorded as 2.5%; this is now 3.4% - double the National rate of 1.8%. A further 5 children are expected to meet thresholds and pass through panel in this academic year – leading to a 4.2%. We resided within the 2nd quintile however that is likely to increase to the 1st quintile in the next IDSR. |
25% of the school population is currently registered on the SEN register – stabilising from an increase of 11% over four years. There are now 152 children registered with SEN an decrease of 9 on last year. Boys remain dominant in SEN registration and this is broadly in line with children off roll. Boys are now 1.5 times more likely to be on the SEN register. The are 5 times more likely to secure an EHCP. Core need in school continues to be ‘speech, language or communication need’ (32 children); Social emotional and mental health (25 children). However, the SENCO is currently reviewing need records and adjusting ranked need (some children have multiple need). It is thought that SEMH and Autistic spectrum need will increase as part of this exercise. Using and combining new friendship data, outcomes have confirmed that children registered with SEN are more than 10X (5x last year) more likely to experience significant or exceptional issues within their friendships. For children not registered for SEN the proportion of significant+ friendship issues is tiny (<2%). There are currently 6 hours per week class based TA time increased from 3 hours 33 minutes per week 2019/20 (914 hours/152 SEN) available for each child on average at SEN register – this constitutes a significant and essential (long over due) increase to meet SEN need. The number of hours difference between calculated need and employed is significantly lower compared to last year at 130 hours per week shortfall. There is currently an excess of £100,000 spent on SEN, PP, EAL – the impact of this would be most keenly felt in building & capital, leadership and learning resources |
Children Looked After
| Latest School Level Data |
|
The proportion of children in care and experiencing care has significantly reduced to 1 from 4. With a further 5 subject to special guardianship/ residency orders. There are 4 children adopted from the UK. The overall number of children in care or adopted has decreased by 1 to 10. Overwhelmingly, children subject to care and adoptions arrangements, present notably greater need. Although the group numbers are small and caution is needed with proportions: They are twice as likely to have special educational needs and are far more likely to have an EHCP 20% against 3% for the children that are not/ have not been in care. 5/10 Challenging behaviour is far more likely to be experienced – High+ risk 2/10 Significant friendship issues 2/10 |
Friendships
| Latest School Level Data |
|
This is the second year this data has been available and it is quite striking, particularly for less able and more vulnerable children. The quality of Friendships are improving marginally when we compare children off roll with those on roll (although this may be influenced by subjective judgement bias). Friendships between children are overwhelmingly stable and positive within school >80%. There are a small minority of children @5% (27 children) where there are significant or exceptional issues. The proportion of stable and positive friendships is broadly consistent in each year group. However, again this year, the proportion of children noted with significant friendship issues in Y3&4 is more than twice that of Y5&6. Friendship proportions between genders are broadly similar at each quality level except for ‘significant issues’ for boys which is higher. Pupil Premium children are more than twice as likely to have difficulties in their friendships. Similar to pupil premium (and a proportion are the same children) children with SEN consistently have poorer quality friendships - @ more than five times more likely to have significant or exceptional issues. There is a very clear and broadly consistent relationship between friendship quality and academic target. The higher the academic target the higher the quality of friendship is noted. |
Behaviour
| Latest School Level Data |
|
Behaviour, as judged by teachers is overwhelmingly good or better in school (@88%). Policies, systems and processes to promote good behaviour have good impact reducing potential challenges to a minimum. There is broad consistency between teacher and senior leader judgement for low risk/ good+ behaviour. There are currently 18 children thought to present a high or extremely high risk for behaviour, a notable fall from last year. Boys present a notably higher risk than girls – approximately 5+ times higher at the higher risk threshold. Pupil premium children present double the risk with ‘extremely high risk’ being almost entirely pupil premium. Children with SEN account for almost all high and extremely high behaviour risks. There is a direct relationship between achievement and behaviour challenges. The lower the achievement the higher the behaviour challenge. It is not certain but it is likely that they fuel each other i.e. once learning becomes a challenge behaviour is more likely to be challenging and VICE VERSA |
Homework
| Latest School Level Data |
|
The submission (or rather non-submission) is a very significant concern. Submission of homework judgements between children off roll (Cohort 2015+) and those currently on roll have reduced significantly – at this stage the factors responsible for this are not clear as the homework systems are well established and very flexible to meet almost all family circumstances. It is important to determine whether this is about teacher judgement or a genuine fall in homework engagement that would almost certainly be a portent for reduced achievement. Of greatest concern would be the increase in those submitting ‘rarely’ and ‘never’ @ twice as much. Pupil premium submission continues to be significantly lower than non-pupil premium with only @30% submitting mostly. Pupil premium homework submission has reduced markedly. SEN submission is lower than non-SEN. SEN submission is lower than 50%. Both SEN and NON-SEN children submission has dropped. There is a stark correlation between RWM target setting and submission of homework. This is consistent from year to year. Children with targets ‘above ARE’ submit homework mostly 80%+. Children ‘below ARE’ submit mostly 40%. Effectively they are behind and the gap will increase exponentially. |
Medical and First Aid
| Latest School Level Data |
|
Approximately 20% of the school population visit the medical team frequently or very frequently this is a @110 children (a fall from the previous year when it was @140). Visits are in inverse proportion to age – there is a clear reduction as children progress through school for children visiting the medical team. Pupil premium are more likely to visit frequently+. SEN maintains a similar pattern however the difference is notably reduced compared to last year. Once again, there is a clear link between RWM target and visit frequency to the medical team |
Safeguarding
| Latest School Level Data |
|
Highest Threshold Recorded Data is collated for current safeguarding cases and highest threshold recorded for a child. This is important as the harm that may have been caused to a child when a safeguarding threshold was met initially may well last longer than their period of current registration, it may have lasting impact for various period, including lifelong, therefore it is important to maintain oversight. Equally, for all but a child protection plan, parents may withdraw consent, conditions may not change and current case data alone would not reflect longer term damage to a child or challenge within school. 95 children (15%+) on roll currently have been subject to the highest form of child protection and concern and/or intervention (level 4). This proportion is @double the proportion in historic data. Almost 50% of pupil premium children have been referred, placed or received intervention at Level 4, the highest safeguarding threshold. 12+X greater than non pupil premium children. SEN registered children also have a very disproportionate number of children subject to safeguarding at some point in their school career. Although not as extreme as pupil premium group, it is very significant. There is a direct correlation between academic risk/ RWM target estimates and safeguarding thresholds. The higher the academic ability the higher the safeguarding risk i.e. Above ARE target estimate group have @1:20 chance of safeguarding registration internally/ externally against 1:2 chance for below ARE. Current Case Load In 2020-21 there are 30 children (@5%) on the school role who have required a referral to external family support or safeguarding services (this is a significant fall from 43 last year). There are currently 15 at the highest level of safeguarding and child protection. There are a further 60 children currently receiving some level of support internally through the pastoral team. Overall there are 15% of children requiring some form of internal or external safeguarding support currently. |
Socio Economic
|
IDSR (inspection data summary report) |
Latest School Level Data |
|
The proportion of children eligible for free school meals has now fallen below national mean for three years. We are now 2% below the national average of 23%. The proportion reside within the 3rd (middle quintile) The school deprivation factor is in Quartile 4 – more deprived. Although the pupil base is within the average range. |
Local Area Using the latest super output area data (2015 is the latest; 2020 data is due to be published shortly, 5 year publishing period) in excess of half of the Chesswood catchment area contains significant proportions confirmed within the bottom 20% of the most deprived areas in England. Key aspects of deprivation affecting the local area, in order of severity, include: living environment deprivation (largely below 2nd decile); health deprivation and disability; employment/ income deprivation. School data The proportion of current FSM is 17% (103) a notable increase compared with the past two years (5%, +29 children). FSM is increasing overtime. There are currently 124 pupil premium children (decreased by 6 from last year) and a further 10 children in receipt of pupil premium plus – 134 overall. This is a decrease of 7 reflecting the fall in pupil numbers. Pupil premium accounts for 22% of school population, this is broadly stable. Once registered on the PP registration the following risks increase
|
Ethnicity
|
IDSR (inspection data summary report) |
Latest School Level Data |
|
The data confirms there is significant ethnic diversity at Chesswood with 13 from the 17 ethnic groups enrolled. 26% of the school community with the largest being White – any other white background. This has changed from Asian or Asian British - Filipino community. |
There are 14 ethnic minority groups recorded. The largest among these are Any other white background – typically European; ‘any other Asian background’ - Filipino Community which had been consistently the largest is now second. There are 158 children registered within an ethnic minority group. This represents 26% of the school population currently. The proportion is consistent in recent years. |
First Language
|
IDSR (inspection data summary report) |
Latest School Level Data |
|
There has been a consistent proportion of pupils whose first language is not English at 18% this has increased by 2% to 20%. We are now 1% lower than national average. The proportion of children with English as an additional language continues to be within the second quintile (highest 40%). |
Other than English, there are 36 languages spoken by children at Chesswood, consistent with previous years – Tagalog/Filipino is the most prevalent (26), followed by a significant change in recent years with Eastern European languages increasing Polish (16), Romanian (8) Lithuanian (5). Other languages – Bengali (9). All other languages = 4 or less 20% of children (124) do not speak English as their first language – the proportion has stabilised following an increase compared with previous years. Currently there are 34 children on the EAL register and a further 22 being monitored. There are 11 children on the register whose English language level is emerging. This group require frequent and substantial support. |
Religion
| Latest School Level Data |
| The proportion of children with a declared religion (40%) continues to be notably less than children with ‘no religion’ 51%. The largest religion is Christianity (in all forms) at 29% (-12% from children off roll), this is part of a decreasing trend. Other major religions account for 7% of the school population (+3%). |